Monday, August 25, 2025

@esbuild/darwin-arm64 and @esbuild/darwin-x64 npm build issue


Original error when building the project.

Specifically the "@esbuild/darwin-arm64" package is present but this platform needs the "@esbuild/darwin-x64" package instead. People often get into this situation by installing esbuild with npm running inside of Rosetta 2 and then trying to use it with node running outside of Rosetta 2, or vice versa (Rosetta 2 is Apple's on-the-fly x86_64-to-arm64 translation service).


Clear old binaries

Remove the incorrect esbuild install:

rm -rf node_modules/esbuild node_modules/@esbuild


Reinstall with matching architecture

    • If you want ARM64 (Apple Silicon, recommended):

      arch -arm64 npm install esbuild
    • If you want x64 (Intel / Rosetta):

      arch -x86_64 npm install esbuild
  • Ensure Node matches

    • Check what architecture your Node process is:

      node -p "process.arch"


  • Friday, March 14, 2025

    How to navigate to step definition from the feature file in VS code


    • Install Cucumber for Visual Studio Code plugin
    • Go to the settings of the plugin.
    • Locate the cucumber. Features setting  and click on Edit in Settings.json.


    • This will open the settings.json file under Application Support/Code/User (On mac)
    • Basically, this is not the settings file you can find inside the .vscode/settings.json file at your project.

    • Add the exact format of the feature files are available.


    • Then at the same file, locate cucumber.glue.
    • If not, add a new entry as for the below format.

    • Save and restart the VS Code.

    • Now you should be able to navigate to the step definition quickly from your feature file.

    Tuesday, February 25, 2025

    How to implement screen shot comaprison with WebdriverIO

     Get the Visual service to your wdio.conf file.

     services: [

        [

          "visual",

          {

            baselineFolder: path.join(process.cwd(), "snapshot", "baseline"),

            formatImageName: "{tag}-{width}x{height}",

            screenshotPath: path.join(process.cwd(), "screenshot"),

            savePerInstance: true,

            addIOSBezelCorners: true,

          },

        ],

      ],


    Then use below code to validate.

    It will be something like:

      const element = WishlistScreen.EllipsisItemList();

      const formattedElementName = elementName.replace(/ /g, "-").toLowerCase();

      // Verify the snapshot of the element

      await expect(element).toMatchElementSnapshot(`${global.brand.toLowerCase()}-${formattedElementName}`, 8);


    Thursday, May 9, 2024

    Jmeter to Grafana dashboard using core influx DB back end listener.

     Important things.

    1). Make sure to set influxdbToken at the jmeter influx DB back end listener

    Get the token:


    2). URL need to be have below format:

    http://localhost:8086/api/v2/write?org=cja&bucket=jtest

    • Highlighted Properties must available to view transactions at the Grafana dashboard.
    • Set summary Only to True to get transaction level details at Grafana.


    3). Make sure to import valid Grafana template.

    Because only dashboard ID 5496 was using core influx DB back end listener.


    4). Make sure to set "Authorization" header "Token <ur token>" at grafana data source configuration.

    5). Also set the correct database name. Its the bucket name at InfluxDB


    Uploading: 88615 of 88615 bytes uploaded.


    Monday, April 8, 2024

    Fix - javax.net.ssl.SSLHandshakeException: PKIX path building failed: sun.security.provider.certpath.SunCertPathBuilderException: unable to find valid certification

    Download the certificate from the web browser and install it using keytools.

    Click on "Connection is secure"


    Click on certificate is valid.

    Click on export and save it to your hard disk


    Open CMD and type below command.

    keytool -import -alias ANY_NAME_YOU_WANT_TO_GIVE -file PATH_TO_YOUR_CERTIFICATE -keystore PATH_OF_JAVA_KEYSTORE


    PATH_OF_JAVA_KEYSTORE - file will be available at C:\Program Files\Amazon Corretto\jdk11.0.20_9\lib\security


    If the keytools are not recognize as a valid command, add java/bin folder to your system environment variable paths.

    Sunday, March 24, 2024

    How to execute selenium test in Github Actions

     Create a simple Maven TestNG Selenium project as below.


            System.setProperty("webdriver.chrome.driver", "/usr/local/bin/chromedriver");

            ChromeOptions chromeOptions = new ChromeOptions();

            chromeOptions.addArguments("--headless");

            driver = new ChromeDriver(chromeOptions);

            driver.get("https://www.xxxx.com/playlists");

            WebElement element = driver.findElement(By.xpath("(//*[@class='yt-simple-endpoint style-scope ytd-playlist-thumbnail'])[4]"));

            element.click();

            driver.quit();


    Make sure to give a correct web driver path when you are testing the code in our local environment.

    We will change it when we deploy it to GitHub actions.


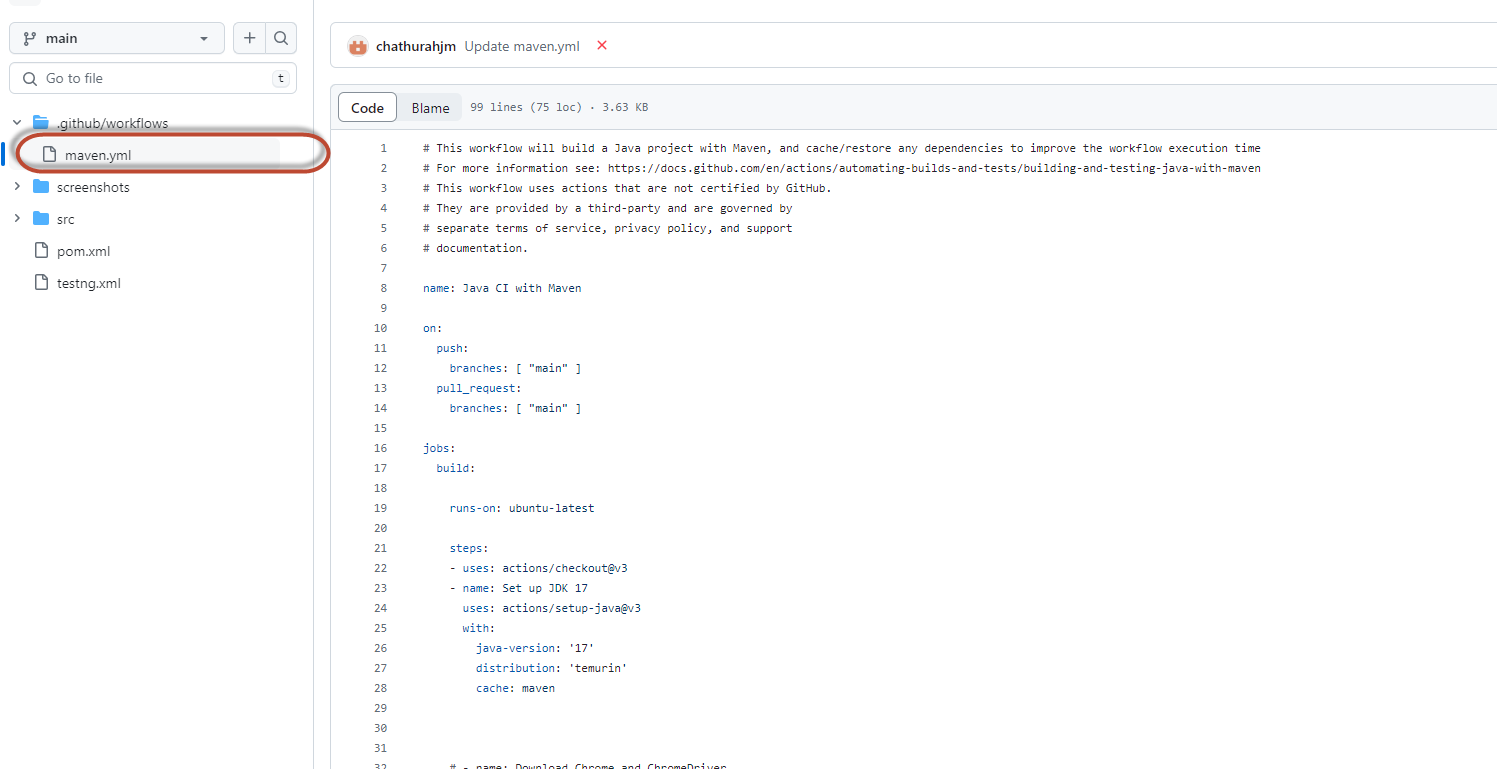
    Now push your code GitHub and enable actions from the project settings section.


    Create a new yml file which will automatically generate when you select maven build project.

    There will be a new yml file available as for the below screen shot.


    In adition to default content I have to add

    • Chrome driver
    • Chrome web browser

    This is the code to download above from the yml file.

     # Download Chrome version 114.0.5735.90

        - name: Download ChromeDriver

          run: | 


              # Download Chrome version 114.0.5735.90

              wget -q "https://dl.google.com/linux/chrome/deb/pool/main/g/google-chrome-stable/google-chrome-stable_114.0.5735.90-1_amd64.deb" -O chrome.deb

              # Install Chrome

              sudo dpkg -i chrome.deb

              # Install dependencies

              sudo apt-get install -f

              # Clean up

              rm chrome.deb

              LATEST_CHROMEDRIVER_VERSION=$(curl -s "https://chromedriver.storage.googleapis.com/LATEST_RELEASE")

              wget "https://chromedriver.storage.googleapis.com/${LATEST_CHROMEDRIVER_VERSION}/chromedriver_linux64.zip" -P ~/

              unzip ~/chromedriver_linux64.zip -d ~/ && rm ~/chromedriver_linux64.zip

              sudo mv -f ~/chromedriver /usr/local/bin/chromedriver

              sudo chmod +x /usr/local/bin/chromedriver


    Then add below code to execute the test.

        - name: Build with Maven

          run: mvn clean install -B


    You can find the full code with copying screen shots  at https://github.com/chathurahjm/gitActionWIthScreenShots


    Friday, March 1, 2024

    How to execute custome jar file in JMeter

    1). Create your jar file using Eclipse.

    2). Because Eclipse will allow you to convert a single java method (without any main method) to a jar file.

    • Package name  : tempDBUpdate
    • Class name : update
    • Method name : updatedb

    All my libraries are inside reference Libraries folder.


    3). Convert to a jar file by right-click on your project → select Export → Select JAR file under java folder.


    4). Move the newly generated jar file to JMeter \apache-jmeter-5.6.3\apache-jmeter-5.6.3\lib\ext folder.

    5). From open JMeter and add a JSR223 Sampler

    6). Set language as groovy

    7). Import the jar file as for the line number 1.

    8). Create an object of the class as for the line 3.

    9). Call the method.


    Dont use Main method to call in J Meter as it will give errors and it will not call the actual Main method implementations.

    Don't use IntelliJ to cremate jar files as IntelliJ only allow Main method to convert to jar file.